


As a supplier of passive lightning counters, I've had numerous conversations with customers about analyzing the data these devices collect. It's a topic that's both fascinating and crucial, especially in industries where lightning can pose a significant risk. So, what kind of software is needed to make sense of the data from a passive lightning counter? Let's dive in.
First off, let's understand what a passive lightning counter does. It's a device that records lightning strikes in a particular area without actively transmitting any signals. These counters are great because they're low - maintenance and can provide valuable data over long periods. But the raw data they collect is just a bunch of numbers and timestamps. That's where software comes in.
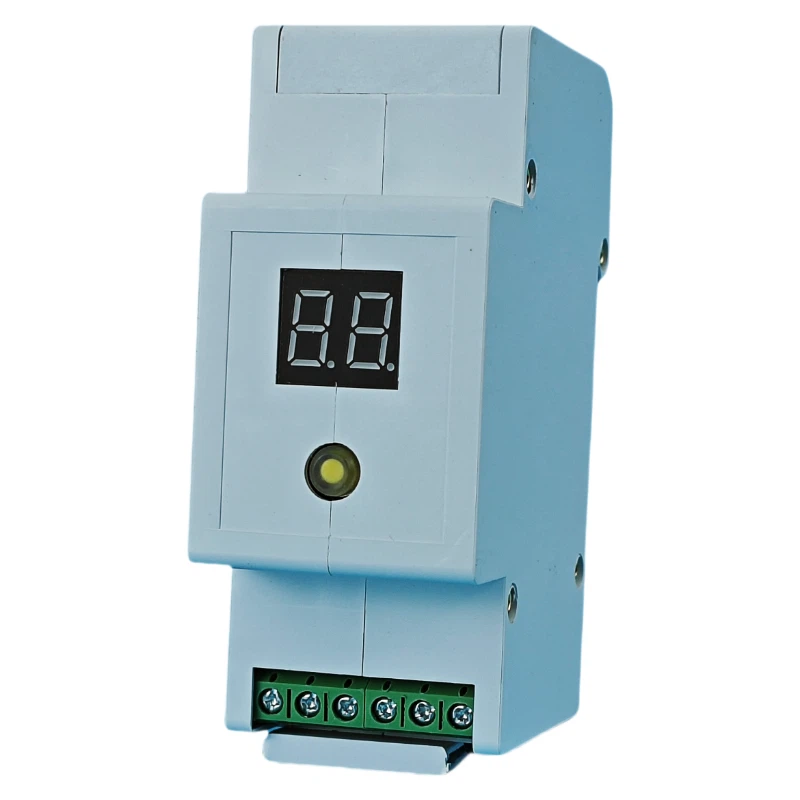
One of the most basic requirements for the software is data import. The software should be able to easily import data from the passive lightning counter. This might seem like a no - brainer, but it can be tricky. Different models of passive lightning counters may have different data formats. For example, some might save data in a simple CSV (Comma - Separated Values) file, while others could use a proprietary binary format. The software needs to be flexible enough to handle these various formats. Our Passive Lightning Counter Module is designed to work with a wide range of data import options, ensuring seamless integration with different software solutions.
Once the data is imported, the software should be able to perform basic data cleaning. In the real world, data can be messy. There might be missing values, incorrect timestamps, or outliers. For instance, a sudden spike in the data might be due to a malfunction in the counter rather than an actual lightning event. The software should be able to identify and deal with these issues. It could use algorithms to detect outliers based on statistical methods, like the inter - quartile range. And for missing values, it could use interpolation techniques to estimate what the values should be.
Visualization is another key aspect. Humans are visual creatures, and it's much easier to understand data when it's presented in a graphical form. The software should be able to create various types of visualizations, such as line charts to show the frequency of lightning strikes over time, bar charts to compare the number of strikes in different months or seasons, and maps to show the geographical distribution of lightning strikes. For example, a line chart can quickly show if there's an increasing or decreasing trend in lightning activity, which is crucial for long - term risk assessment.
But visualization is not just about making pretty pictures. It should also be interactive. The user should be able to zoom in on a particular time period, hover over data points to get more information, and switch between different types of visualizations. This interactivity allows for a more in - depth exploration of the data.
In addition to basic data cleaning and visualization, the software should also offer advanced analytics capabilities. One important area is risk assessment. The software can use historical data to predict the likelihood of future lightning strikes. It could take into account factors like season, location, and weather patterns. For example, if a particular area has a history of more lightning strikes during the summer months, the software can factor that in when making predictions.
Another aspect of advanced analytics is correlation analysis. The software can analyze how lightning strikes correlate with other factors, such as temperature, humidity, or wind speed. This information can be useful for understanding the environmental conditions that are more likely to lead to lightning activity. For example, if there's a strong correlation between high humidity and lightning strikes, it can help in early warning systems.
The software should also support data sharing and collaboration. In many cases, multiple people or teams need access to the lightning data. For example, an electrical utility company might have engineers, safety officers, and management who all need to view and analyze the data. The software should allow for easy sharing of data, either by exporting it in a common format or by providing a secure online platform where multiple users can log in and access the data.
When it comes to choosing the right software, there are a few things to consider. First, it should be user - friendly. Not everyone is a data scientist, so the software should have an intuitive interface that's easy to navigate. Second, it should be scalable. As your business grows or as you collect more data over time, the software should be able to handle the increased volume without a significant drop in performance.
Third, it should have good customer support. If you run into any issues with the software, you need to be able to get help quickly. Look for a software provider that offers responsive customer support, whether it's through email, phone, or an online chat.
At our company, we understand the importance of having the right software to analyze the data from our passive lightning counters. That's why we work closely with software developers to ensure that our products are compatible with a wide range of software solutions. We also provide guidance to our customers on choosing the best software for their specific needs.
If you're in the market for a passive lightning counter and are looking for software to analyze the data, we'd love to have a chat with you. We can provide more information about our products and help you find the right software solution for your requirements. Whether you're a small business looking to protect your assets or a large corporation with complex risk management needs, we're here to assist you. Contact us to start a conversation about how we can work together to make your lightning data analysis more effective.
References
- Miller, J. (2018). Data Analysis for Environmental Monitoring. Springer.
- Wickham, H. (2016). ggplot2: Elegant Graphics for Data Analysis. Springer.